
A student's guide to post-publication review
Classroom discussion prompts covering study design, statistical flexibility, and effect size
Introduction for teachers
A working paper called “The effect of deactivating Facebook and Instagram on users’ emotional state” (Allcott et al. (2025)) recently went viral with over 5 million views:
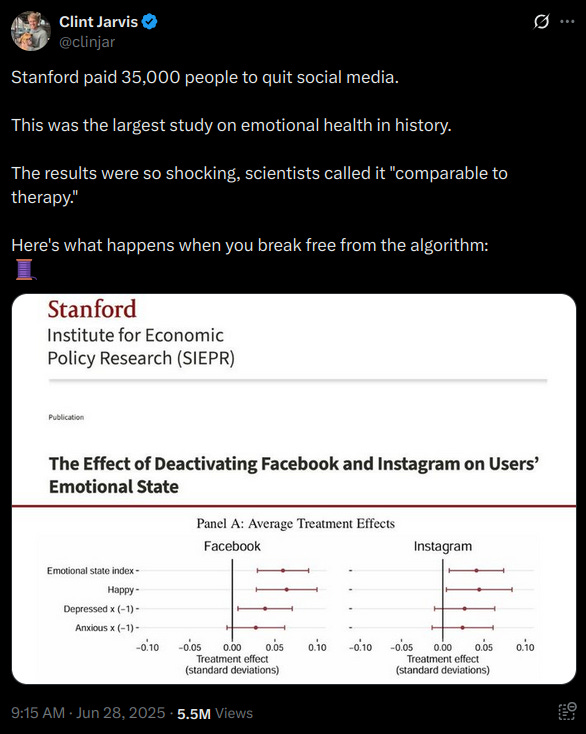
Not only is the “screen time” literature rife with practically-null findings and evidence of p-hacking even at the meta-analytic level, Allcott et al. has clear red flags that should show up in any post-publication or peer review.
Despite the small effects, screen time is famously so fractious that when researchers did a Specification Curve Analysis — all defensible analyses to address a large range of statistical opinions — researchers on the other side of the debate redid the analysis on a subgroup and vehemently disagreed. The “potatoes vs. hard drugs” debate continues to this day with each group comparing social media to potatoes, and hard drugs respectively.
In the case of Allcott et al., the debate may be lopsided. While 5 million people saw the tweet, only about 15 downloaded the preregistration.
The following prompts are aimed at classroom discussion with unanswered take-home questions at the end. A number of issues in the paper are not covered that students can discover themselves, some of which I may have missed myself. Also, the paper will likely be critiqued again in peer review and in other posts. Students might enjoy trying to predict where the debate goes.
Introduction for students
How to do critical appraisal of research
When considering these problems, try to put yourself in the mind of a researcher. Have you ever been late trying to finish an essay for class and you can't think of anything interesting or original to write about? Have you felt pressure to find something, anything to say, and tinier and tinier observations about the material suddenly seem relevant?
Researchers face the same pressures except their work may take years to plan and carry out. There's tremendous pressure, both internally and from the journals that publish papers, to analyze and then write so it sounds like an interesting discovery has been made.
The paper we'll discuss was preregistered, which is a way of helping to prevent authors from claiming a discovery too easily.
Consider the difference between looking at some clouds and saying, “That looks like a rabbit!” and saying, “I think there's going to be a cloud that looks like a rabbit tomorrow.” A preregistration is saying what you're looking for in advance. Timing matters and it matters how specific your prediction is.
The authors didn't follow their preregistration exactly, which is considered legitimate if disclosed. The question is “did they disclose everything they changed?” and “do their changes threaten the validity of the findings?”
As you go through the prompts, think about the idea that researchers feel pressure to publish, even if their results are null, or “not a discovery.” (Null results should be published too, but they are unfortunately harder to publish and get attention for.) Do you find evidence of this? Are there outright errors or miscalculations? Are you being too skeptical and seeing errors that aren’t there?
These are things to think about when reviewing evidence in a scientific paper. You're not going to know if you’re detecting the authors’ motivations correctly unless the authors come out and say, “We didn't find anything interesting but we wanted to get into this journal anyway!” Thinking about the publication process is a way to help find the most common red flags. Always check yourself too and think about ways you could be wrong. If you are wrong, backtrack and try to make your review stronger. See if you can hold up to scrutiny too!
Prompt 1: The Abstract
This is where the authors summarize their paper and state their main findings.
We estimate the effect of social media deactivation on users’ emotional state in two large randomized experiments before the 2020 U.S. election. People who deactivated Facebook for the six weeks before the election reported a 0.060 standard deviation improvement in an index of happiness, depression, and anxiety, relative to controls who deactivated for just the first of those six weeks. People who deactivated Instagram for those six weeks reported a 0.041 standard deviation improvement relative to controls. Exploratory analysis suggests the Facebook effect is driven by people over 35, while the Instagram effect is driven by women under 25.
What are the main findings and their effect sizes (magnitude of the discovery)?
Suggested answer:
The main findings are that Facebook and Instagram deactivation was associated with an effect size of 0.060 and 0.041 standard deviations respectively on an index measuring happiness. Social media users who were randomly selected to deactivate their accounts reported being happier compared to the control group.
The secondary findings were that subgroups of users had different experiences. Facebook users over 35, and Instagram users under 25 had the greatest effects.
Prompt 2: Study design
In this paper, we report the results of the largest-ever experimental study on the effect of social media deactivation on users’ emotional state, which we carried out as part of a broader study of political outcomes before the 2020 U.S. presidential election. We recruited 19,857 Facebook users and 15,585 Instagram users who spent at least 15 minutes per day on the respective platform. We randomly assigned 27 percent of participants to a treatment group that was offered payment for deactivating their accounts for the six weeks before the election. The remaining participants formed a control group that was paid to deactivate for just the first of those six weeks. Our baseline and endline surveys elicited three measures of self-reported emotional state—how much of the time during the past four weeks that people felt happy, depressed, or anxious...
What are some rigorous aspects of the study design? Are there any confounds or other issues with the metrics used? (A confound is a factor that may work against the evidence of a discovery. It may not be declared openly.)
Suggested answer:
Rigorous aspects
The study is randomized, which means the researchers controlled who got the “treatment,” in this case deactivation of social media accounts, randomly so that any effect the treatment has can be attributed to the treatment and not other differences between the two groups. In an observational study, where the researchers have no control over who gets the treatment, the effect may be due to what caused the subjects to get the treatment instead of the treatment itself.
For instance, observational studies of patients at a hospital can, ironically, have more healthy people than the general population because healthy people tend to be more concerned with health, and go to the hospital more often for some treatments. (In other areas, this is reversed and only the most severe cases of a mild disease, for instance, end up in the hospital.)
The study also has a very high sample size. In human subject research, this is the number of participants. Higher sample sizes are generally considered more rigorous, although as sample size increases, smaller effects can be detected. Very large studies are more likely to find something, particularly if they've collected many variables.
These discoveries could lack clinical or practical significance, meaning that they're likely to be real, but humans have to decide how important they are.
Non-rigorous aspects:
The most obvious confound is that participants are paid to participate. If the payments are significant enough, the payments could be what's making users happier.
Self-reported measurements are generally considered less reliable than measurements that can be taken in a lab, or measurements that are less subjective. For instance, participants may be more enthusiastic about social media deactivation than the general population, which may bias their self-assessments.
Note: another source of measurement error is not apparent yet and will be covered in Prompt 4.
Importantly, the study was not blinded. The participants were told the lengths of time their accounts would be deactivated so they knew which arm of the trial they were in. In blinded studies, participants and even researchers are prevented from biasing the results with this knowledge.
Prompt 3: Study design continued
Participants who completed the baseline survey were randomized into two groups: Deactivation (27 percent) and Control (73) percent. The Deactivation group was told that they would receive $150 if they did not log into the focal platform for the next six weeks, while the Control group was told that they would receive $25 if they did not log in for the next week.
Are these payments significant enough to confound the study? Why or why not?
Can you think of a way of measuring the effect of the payments? Was there a way to design the study so participants could be paid but the payment wouldn't affect the results?
Suggested answer:
The effect of the payments could be measured by household income. If participants with lower household income were much more likely to say they felt happier with the higher payment, it could indicate that the payment was a factor.
The payments could be compared to an hour of work. If the effect of an hour of work a week is similar to the effect the study found, the confound could be of the same magnitude as the treatment.
Participants could have been paid the same amount whether they were in the deactivation group or not.
Prompt 4: The survey questions
This paper focuses on the three emotional state questions that were also included:
'Please tell us how much of the time during the past four weeks you felt [happy / depressed / anxious].' The response options were 'All of the time,' 'Often,' 'Sometimes,' 'Rarely,' and 'Never.'...
These three questions were drawn from the European Social Survey Well-being Module (Huppert et al. 2009) and are similar to other established emotional state measures.
From Huppert et al., (2009), the questions should be phrased:
I will now read out a list of the ways you might have felt or behaved in the past week.
Please tell me how much of the time during the past week:
(a) … you felt depressed
...
(d) … you were happy
...
(j) … you felt anxious
...
[Response code: 1 – None or almost none of the time, to 4 – All or almost all of the time]
Are the questions the same as the European Social Survey standard? If not, how are they different and could this affect the findings?
Suggested answer:
The questions do differ from the standard. The wording is slightly different, and the paper used 4 instead of 1 week, which the authors disclosed.
The paper also uses 5 possible responses and the standard has 4. The most significant way they differ, however, is the standard does not label the responses “rarely,” “sometimes,” and “often.” The standard question is written to be exhaustive of the time period: “How much of the time during the past week...,” [emphasis added] whereas the paper's responses can easily be confused to mean “individual instances” of being happy, depressed, or anxious.
This is important because a weaker treatment might affect individual instances of happiness that wouldn't affect whole portions of a week. Saying, “I was happy frequently this week” is different from, “I was happy most of the week.”
Short instances can also both increase at the same time. You could choose that you frequently have happy moments and frequently have sad moments in a single week. However, you couldn't have been happy and sad for 75% of a week. 75% + 75% > 100%.
Prompt 5: Baseline differences
We submitted an initial pre-analysis plan (PAP) on September 22 and a slightly updated final PAP on November 3rd, the day before the endline survey began...
The PAP originally implied that results for all outcomes would be presented in a single paper. However, as we drafted the paper, it became clear that it was not possible to fully present the motivation, related literature, robustness, and interpretation for both the political and emotional state outcomes in a single paper, so we split the results into two.
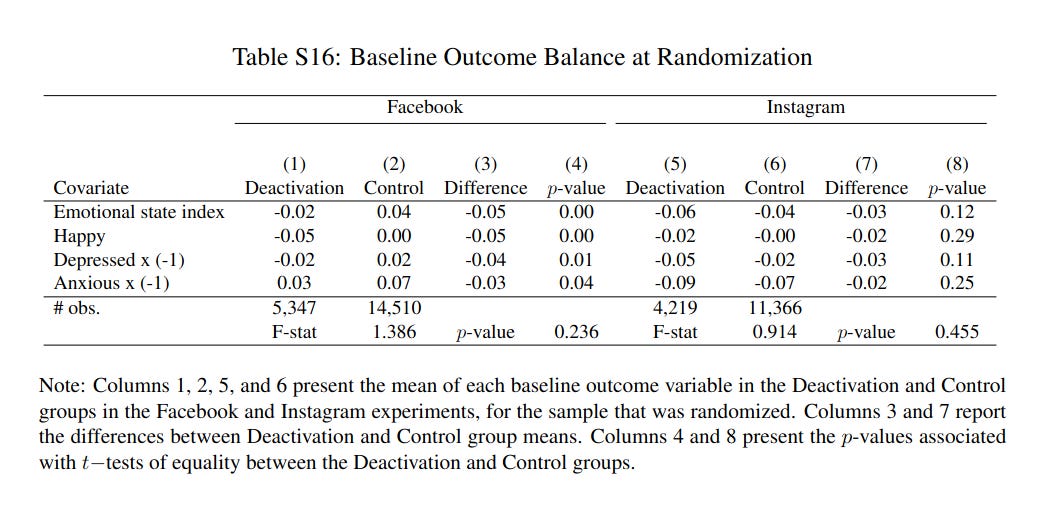
There was a significant difference between the emotional state of the treatment and control groups before the experiment took place. This may happen by chance, particularly when many variables are being measured. The authors also chose this variable to publish on separately. Does this matter in interpreting the results?
Suggested answer:
A preregistration and pre-analysis plan (PAP) is intended to restrict the authors' ability to make statistical choices that take advantage of random noise inherent in any dataset. If the analysis is set before the authors see the data, they won't be able to choose variables that happen to have noise that looks like a discovery. (There are many complexities to this. Exploratory data analysis may be very valuable and it is considered rigorous if disclosed and corrected for multiple comparison, multiple ways of analyzing and subgrouping the data.)
In this case, the authors chose to highlight a variable that randomly had a large imbalance before the experiment began without much justification. We know this is due to chance because the authors randomized participants into the two groups.
Variables with large baseline differences, or imbalance can be corrected or go uncorrected depending on how much the variable is known to be correlated with the outcome of interest. Imbalanced variables are subject to extra scrutiny because they may regress to the mean (become more moderate naturally) or, in this case, unhappy people may simply behave differently and perfectly correcting for this may not be possible.
Participants who score lower on the Emotional State Index may be more affected by the financial incentives, or by the election. The choice of this particular variable to highlight in another paper, which the authors may have reasoned has a better chance of significance and therefore publication, is a potential “red flag.” The fact that the effect size is around the same as the baseline difference also makes it a convincing confound.
Prompt 6: Effect size
Facebook deactivation improved happiness, depression, and anxiety by 0.053, 0.045, and 0.031, respectively. Similarly, Instagram deactivation improved happiness, depression, and anxiety in those original units by 0.037, 0.031, and 0.027, respectively. The average of these six effects is 0.038. This is equivalent to 3.8 percent of people saying they feel happy 'often' instead of 'sometimes.'
From the conclusion:
...the estimated effect sizes are smaller than benchmarks such as the effects of psychological interventions, nationwide mental health trends, and previous experimental estimates in smaller samples.
The authors admit the effect size is small. The benchmarks they used are plotted below:
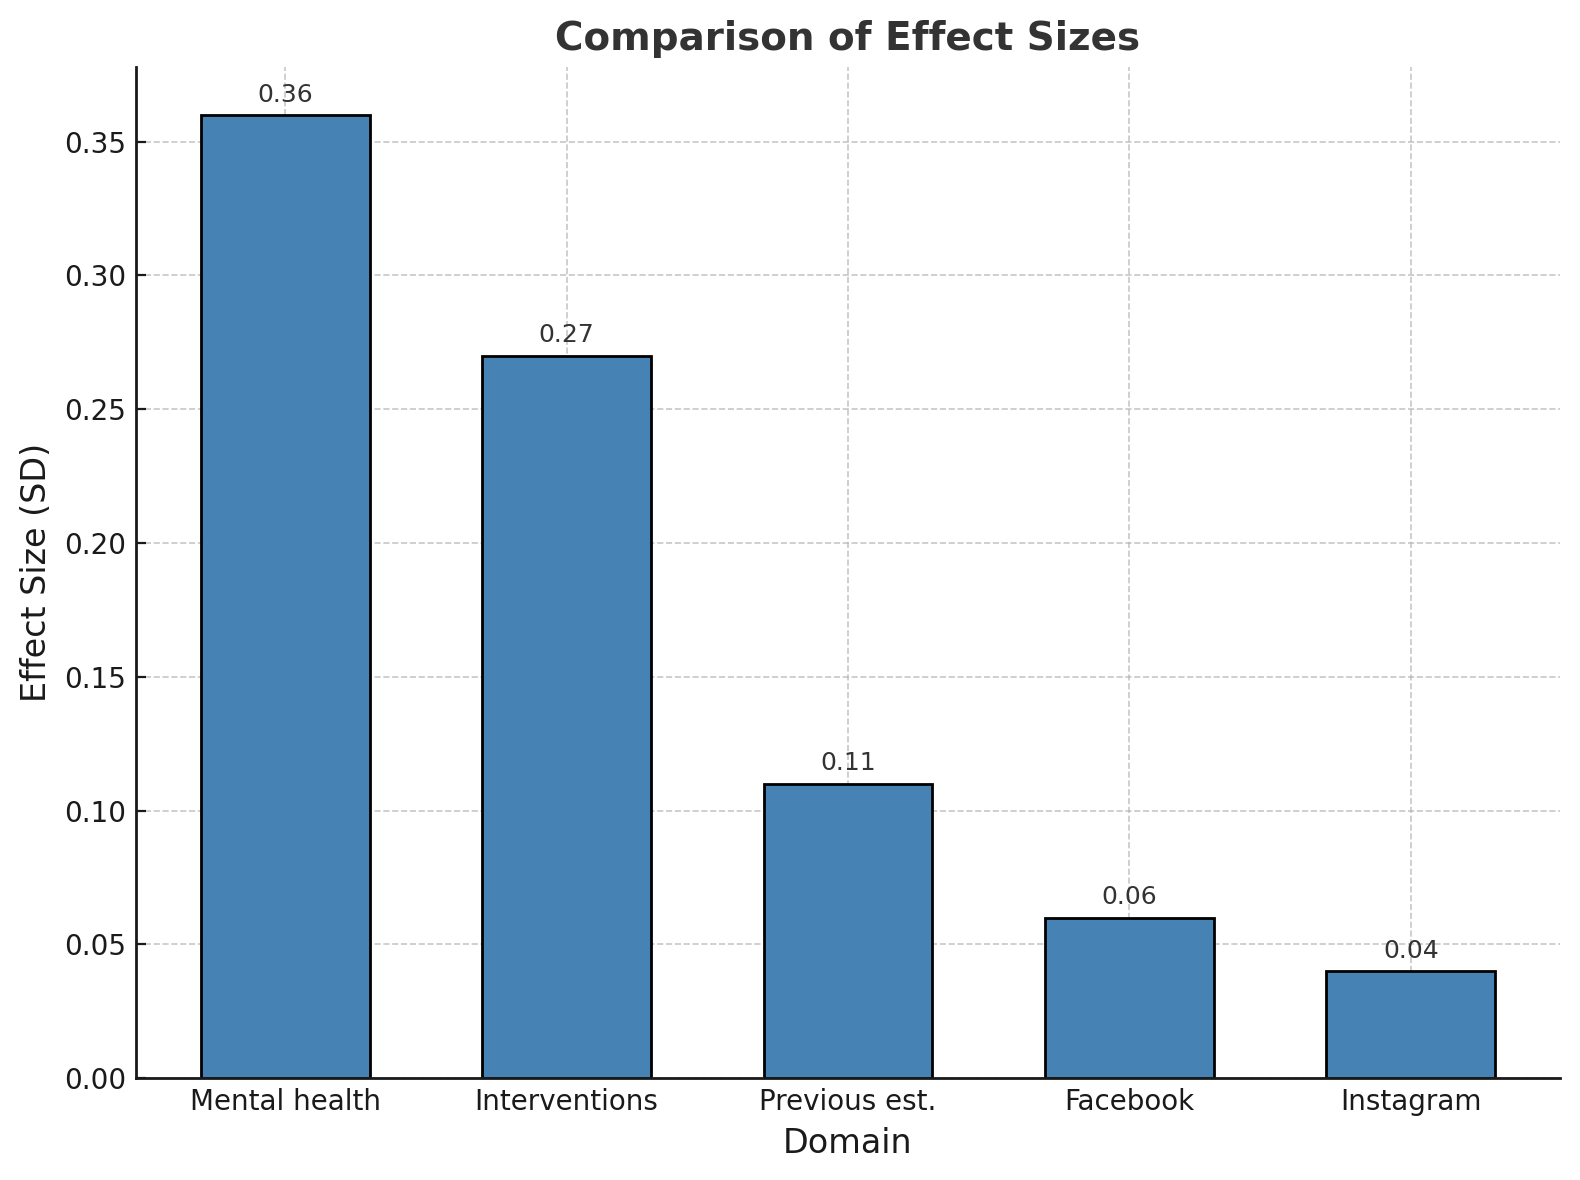
How does this affect your interpretation? Is any effect small enough to ignore on important issues? What about the role of random noise in experiments?
Suggested answer:
A common critique of “screen time” literature is that small effects are not put in context (Allcott et al. may be less guilty of this than others). There's no rule about how small something has to be before it can be ignored, particularly in effect sizes, which are unitless. The clinical or practical importance of the variable matters a lot here too.
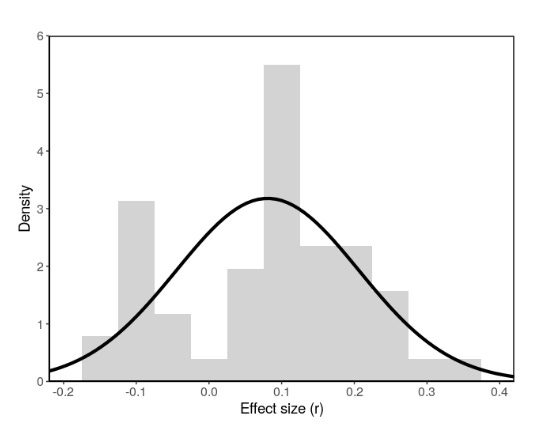
The other factor to consider is publication bias, which tends to skew the results we're able to see (generally) upwards.
Researchers suggest that the wide range of experiences of screen time and social media may be a factor too. Does a small effect for the whole population hide a major effect for a small subset of the population, or for particular experiences online? Some of these factors are addressed in the paper (and they're subject to their own statistical caveats). Others may be harder to measure. How do you measure bullying? Or comparing one's self to others online? The true, large effects may simply be in small corners of screen time research.
Searching for large effects comes with its own caveats just like searching through a particular dataset does. However, there's an argument to be made that “screen time” or even social media is too varied to generalize on all at once.
Take-home
1. The authors say the preregistration said they would use a p-value threshold of 0.05. Did they break this promise? Copy any statements from the paper.
2. How do the other changes in the preregistration and the timing of the changes affect your interpretation of the paper? Are all preregistration changes generally equal or are some more worthy of critique? Are there any “red lines” for you?
3. How would you compare and contrast the responsibilities of the authors with others involved in scientific communication like journalists and social media influencers?
4. How did your prior beliefs about social media affect your interpretation of the paper? Should these beliefs be taken into account? How much do you weigh your own experiences on social media in your beliefs?
5. Do you sympathize with authors of research papers, or these authors in particular who may feel pressure to publish more interesting papers? Do you think pressure affected the paper at all? Do you think some pressure to find statistically-positive results is beneficial?
Bonus question: A PubPeer comment on the companion paper to this one points out undisclosed connections to Facebook's parent company. Do you think this is a bigger factor than pressure to publish? Why or why not?
Ethics of post-publication review
Post-publication review, peer review, and critical assessment are not intended to completely invalidate research outside of some cases of flaws impossible to justify. These critiques act as a “check” on the authors' interpretation and research practices. It's generally good review practice to invite author commentary and comments from others with a different view, and never claim your review is “the final word.” This lesson is no different and responses are welcome.